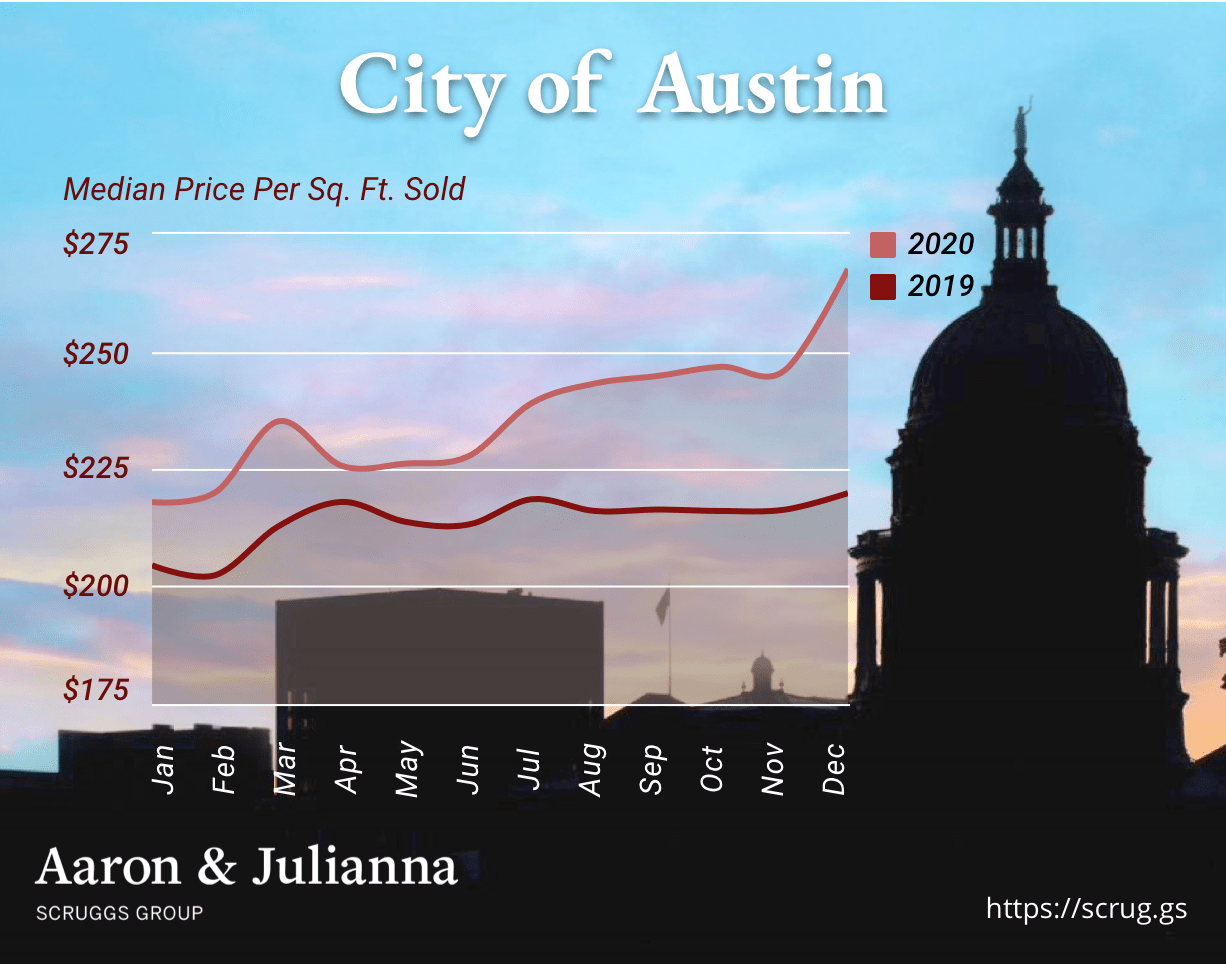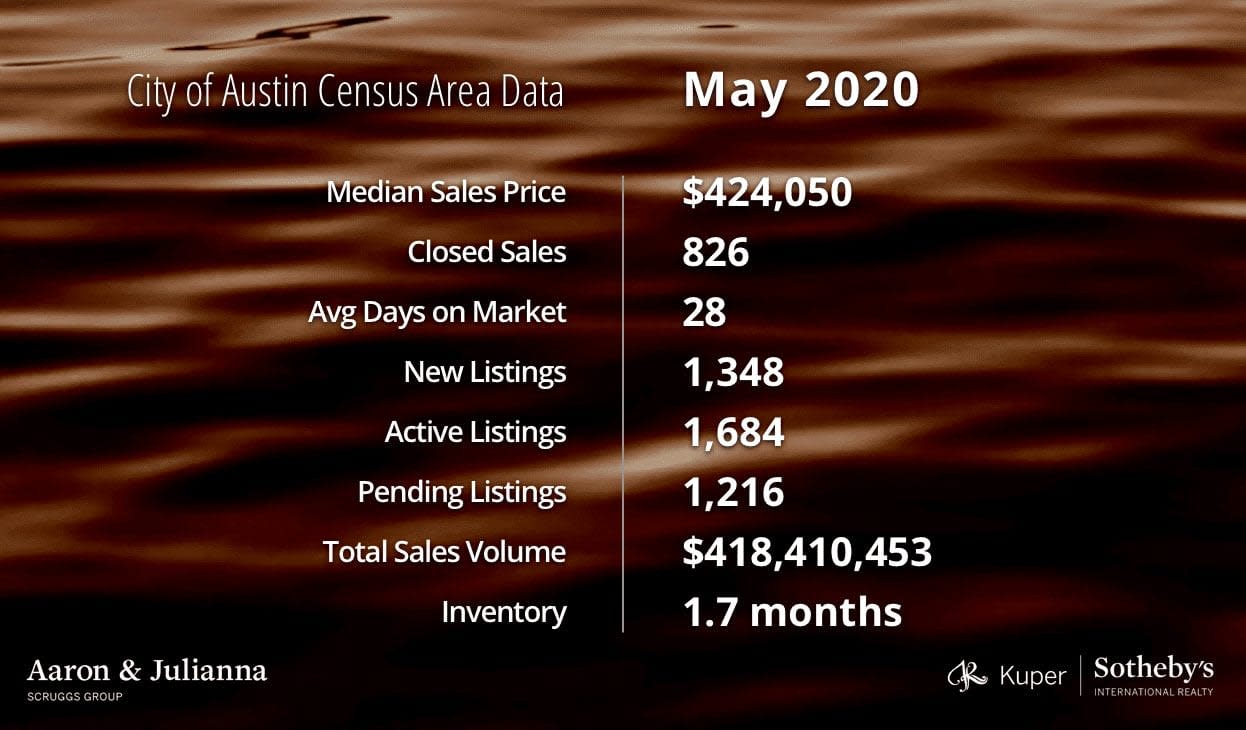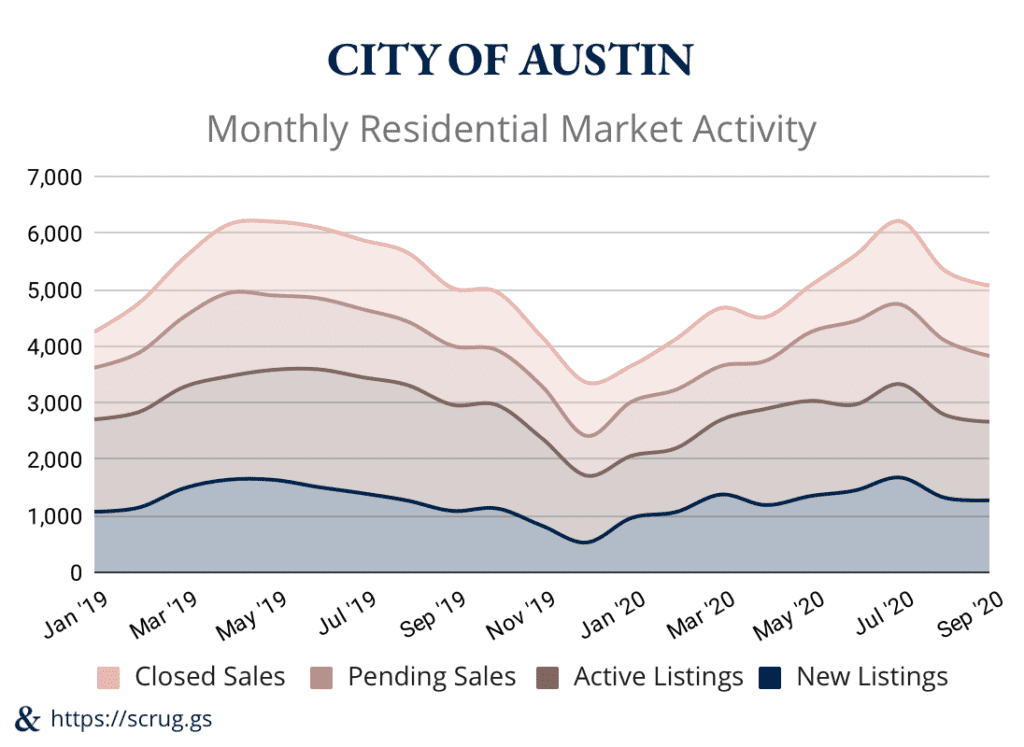
Several local publications recently reported on September’s leap in year-over-year real estate stats. Our report explains why this September is so different from last year. We have lots of graphs that show how COVID shifted market activity later in the year. These graphs also reveal seasonal patterns persisted despite COVID. In 2019, the City of Austin had a pile of activity in the Spring with a slow decline through the Summer that fell in November.
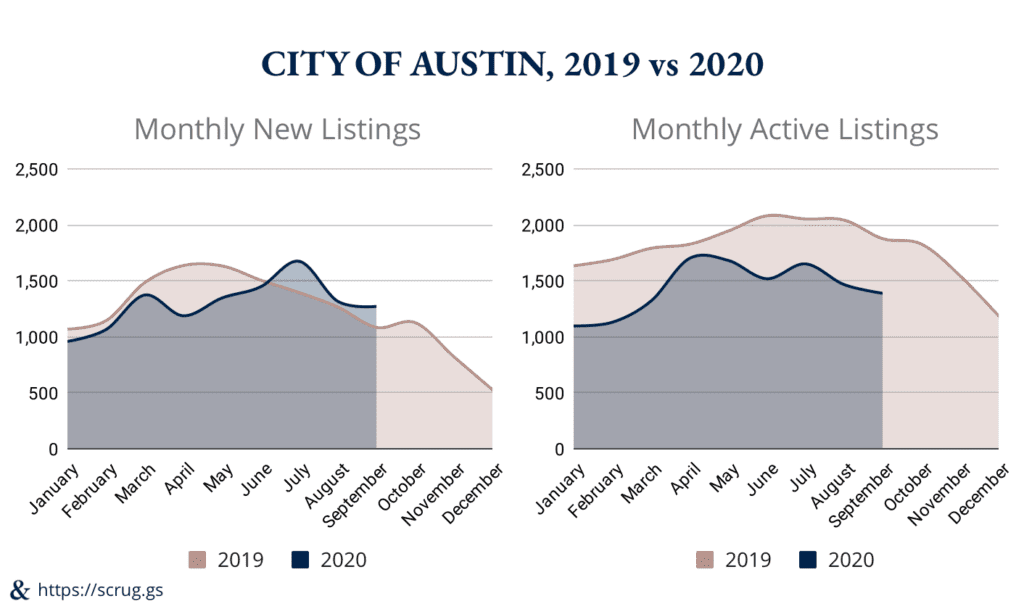
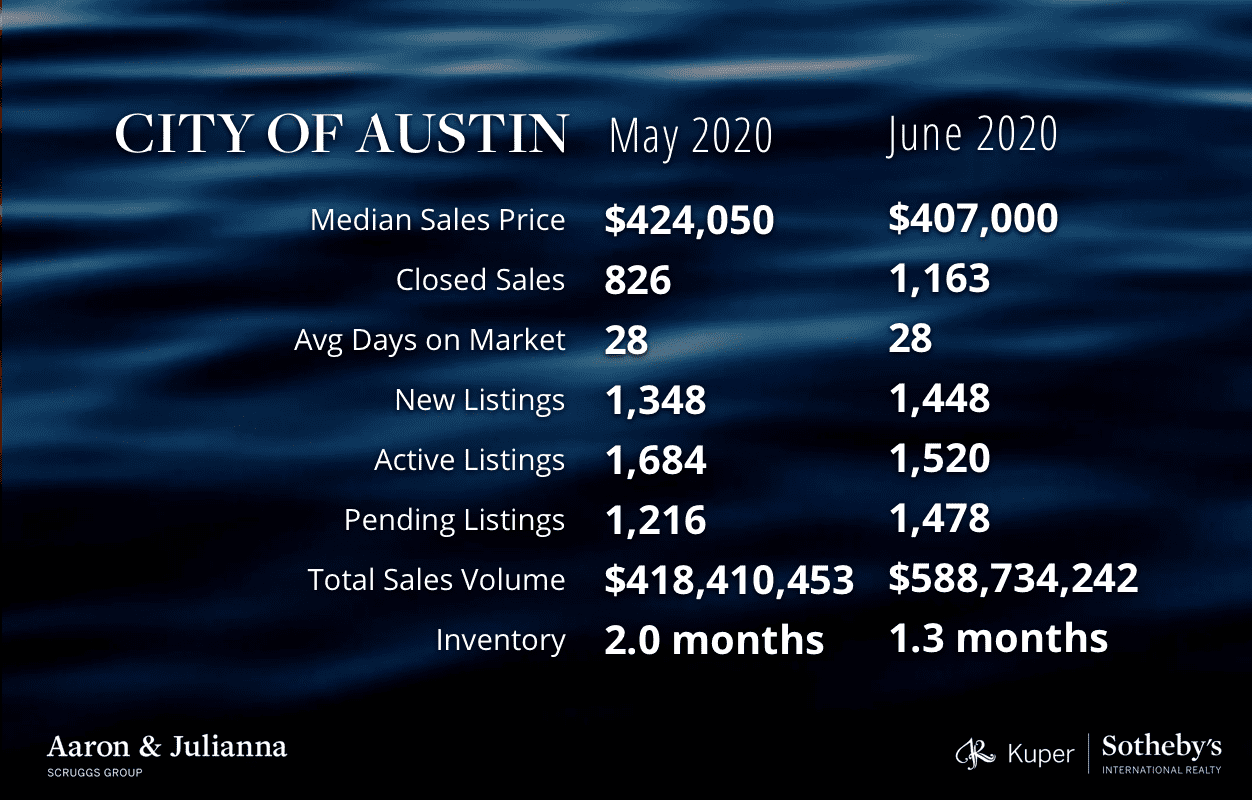
This year, COVID gutted listings, closings and pending sales in April and May. Then, a rogue wave of activity emerged across the board between the shutdown and new school year. Closings and new listings dipped in August while pending sales slowly declined after June’s peak.
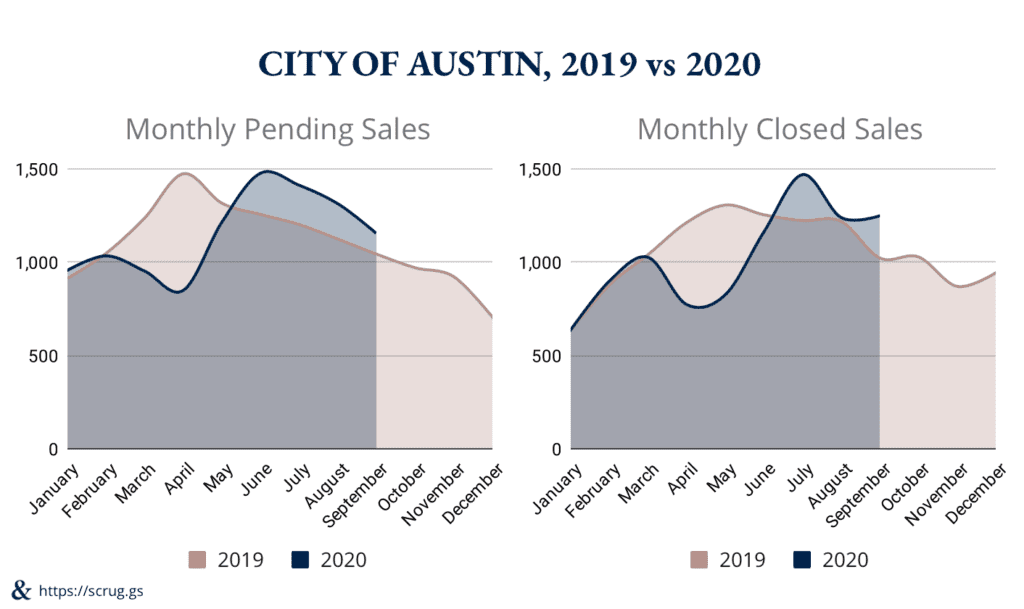
Closed sales were the only metric that didn’t drop in September for the City of Austin census area. Closed sales usually follow the rise or fall of pending sales. Pending sales dropped 7% month-over-month in August, foreshadowing a drop in closed sales. Instead, closed sales rose 0.6% in September. This is likely because some pending sales from the Summer took longer to close than usual. With 30-year mortgage rates below 3%, lending and appraisal congestion delayed some closings. For referrals to lenders who aren’t backed up, feel free to reach out.
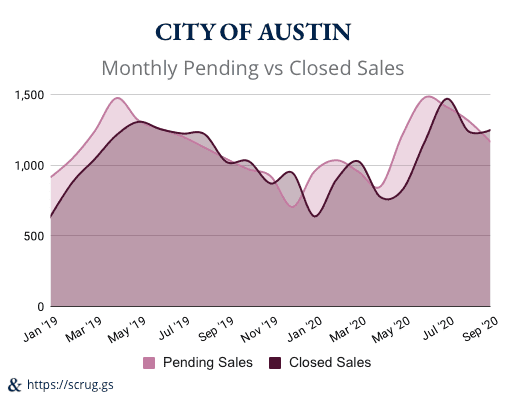
Pending sales usually precede closed sales by a month, unless some closed sales take longer and close in following months. The latter happened this September.
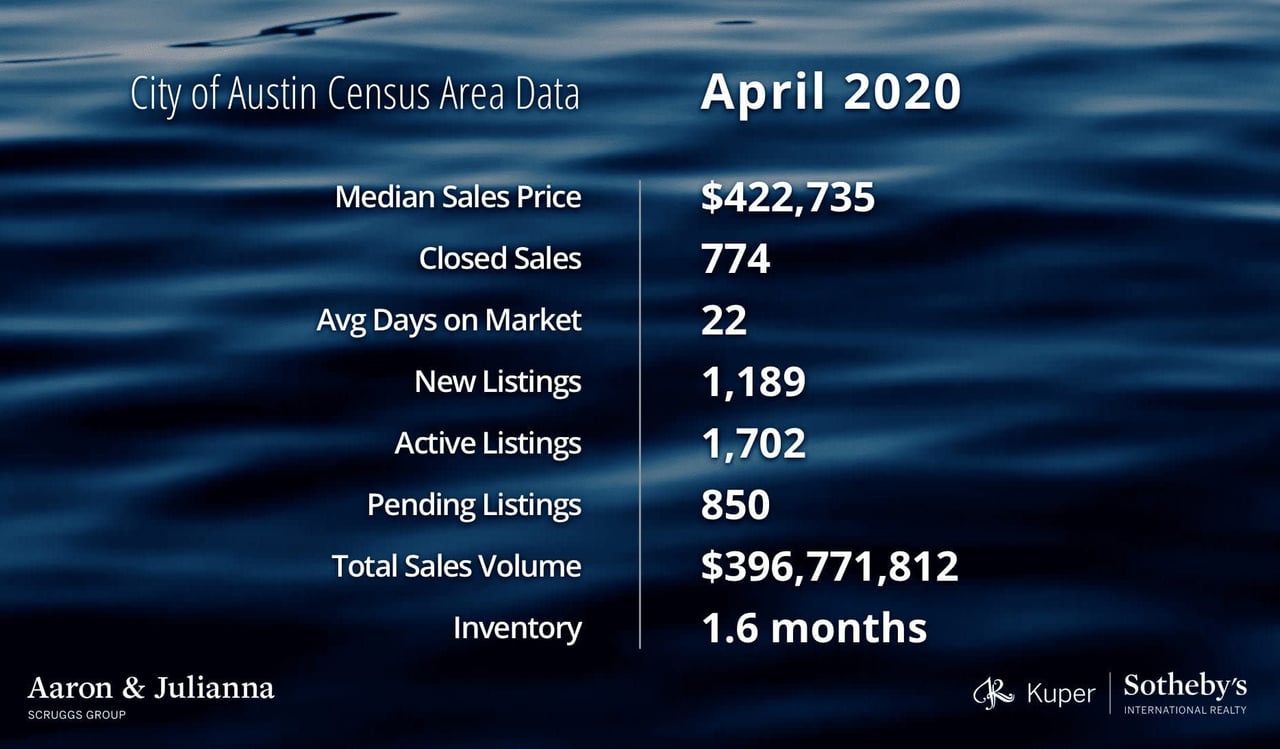
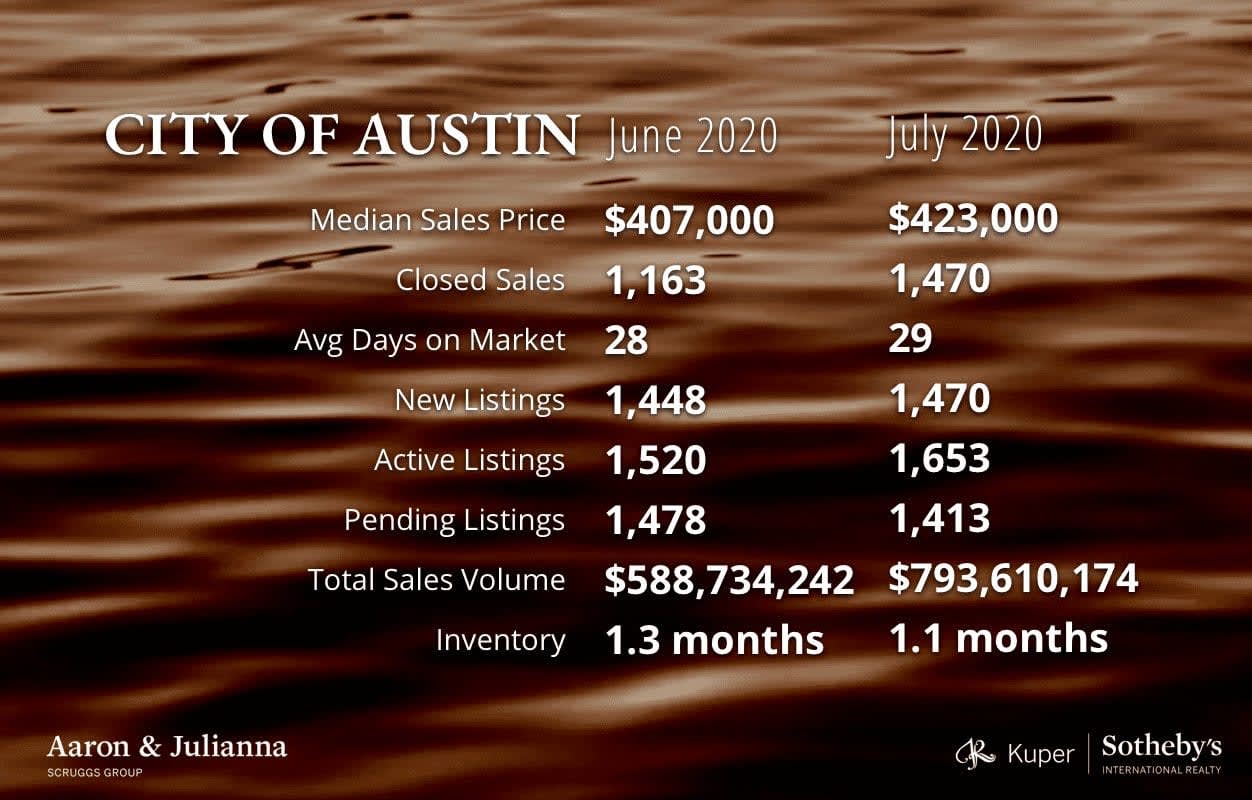
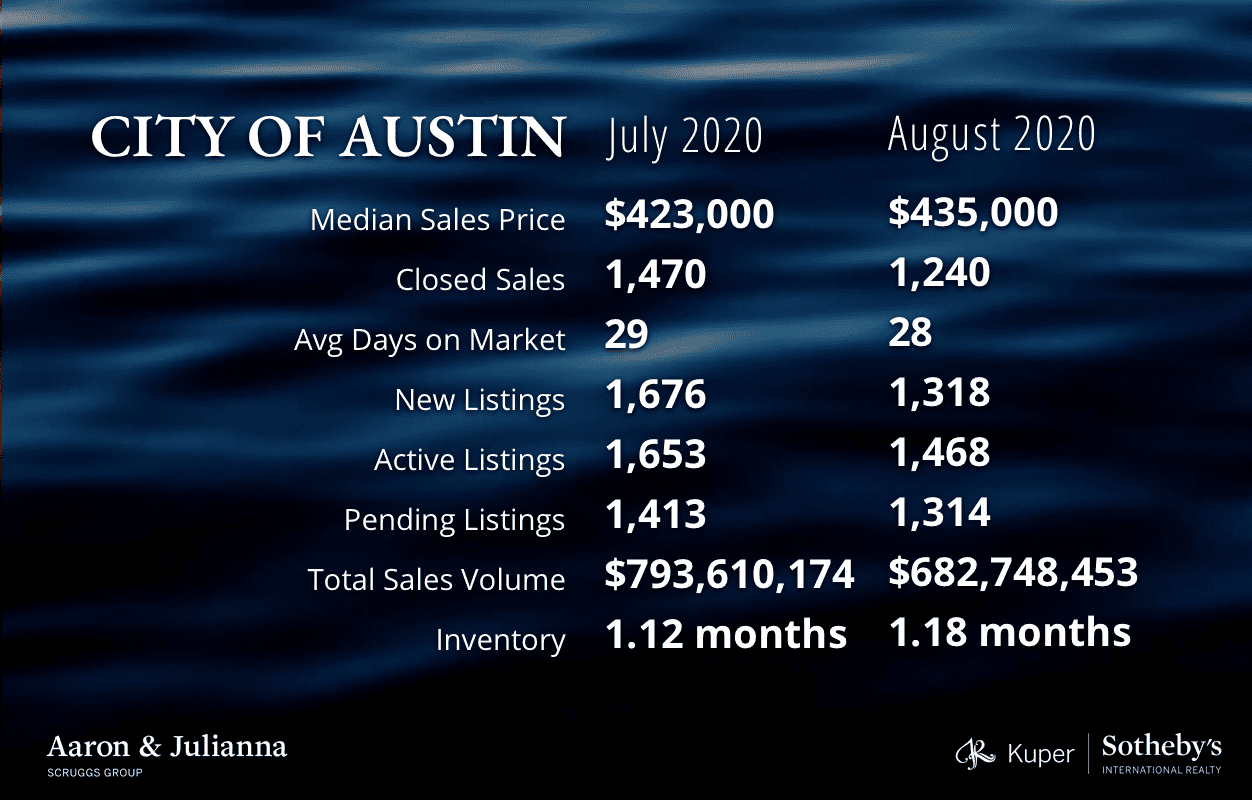
All market activity metrics besides closings dropped from August to September. New listings dropped 3.4% to 1,273, active listings dropped 5.3% to 1,390, and pending sales dropped 11.4% to 1,164.
The shutdown in April halted the typical flood of Spring listings and sales.
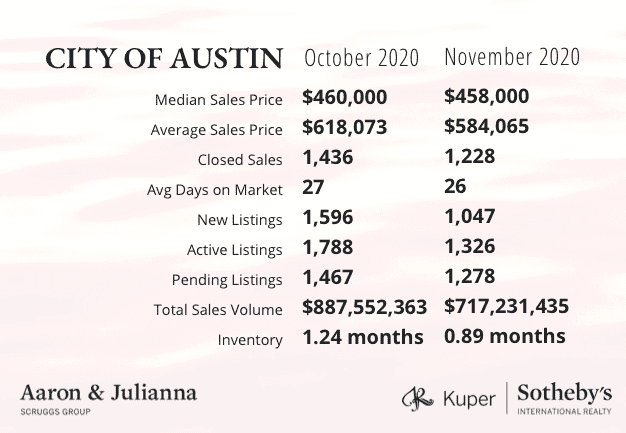
The graphs above show how the shutdown in April and May pushed activity forward in the year. Back to school still caused a lull and activity is descending in Autumn as it would in a normal year. If seasonal trends hold true, there will continue to be less activity in the coming months. Restricted travel and holiday events could curb that slowdown. But buyers and sellers are often shy until the inauguration in an election year. The decision of when to buy or sell depends on your market. If you have questions about Central Austin, get in touch for expert advice. Next, let’s look at our favorite indicator of housing affordability: total sales volume. Sales volume is a factor of closed sales and average sales price. More closed sales would cause Austin’s average sales price to grow at a more sustainable rate.
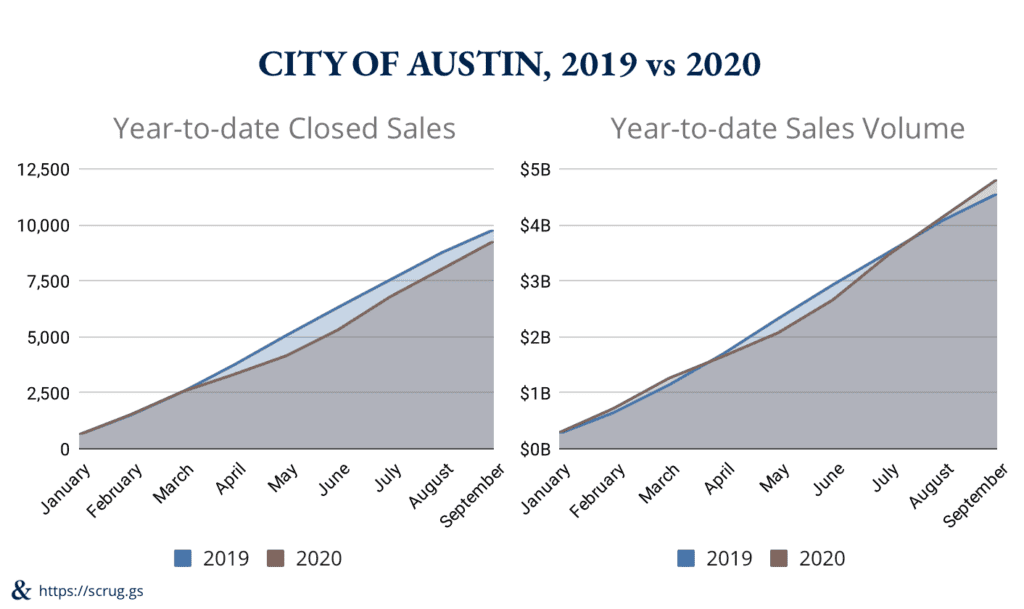
2020 year-to-date closed sales are behind those of 2019. 2020 year-to-date sales volume surpassed 2019 because prices are higher this year.
As of September 2020, year-to-date home sales were down almost 5% year-over-year. Still, year-to-date sales volume surpassed that of 2019 by 6.4%. That’s because the average home sale price was up 15.4% year-over-year. Housing inventory is failing to meet demand, and Austinites are paying the price.
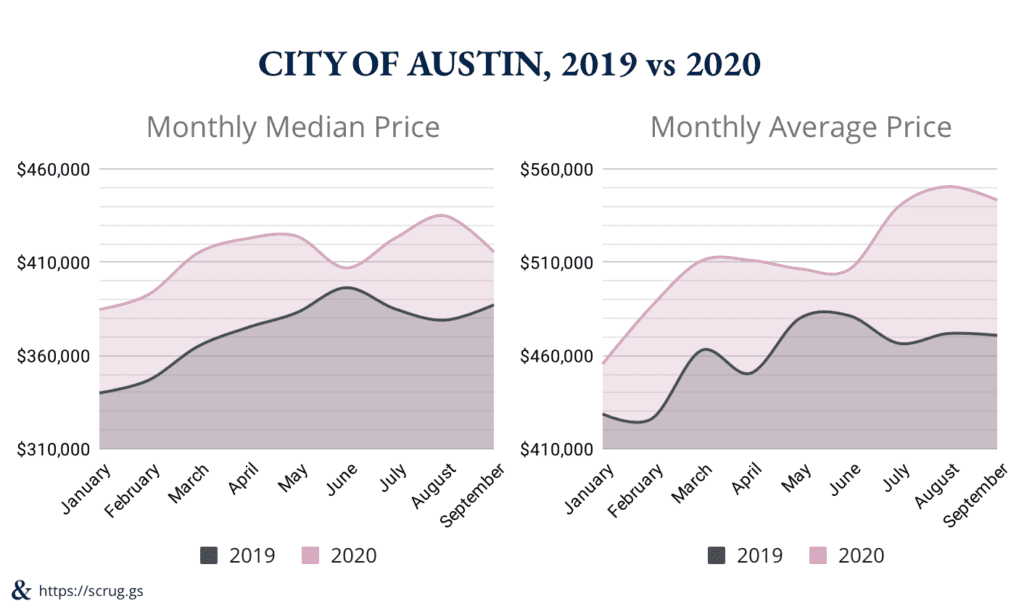
Between January and September, the monthly average home sales price climbed $42K in 2019 and almost $88K in 2020. In that same period, the median rose $47K in 2019 and $30K in 2020.
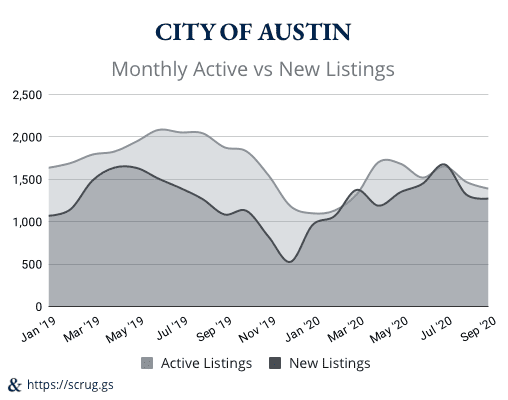
Most home sales start with a listing. Year-to-date listings are down 4% year-over-year. That 4% equates to 491 fewer listings year-to-date. Austin needs new homes to grow housing inventory and address affordability. Of this year’s 491 fewer listings, 400 (81%) were new construction.
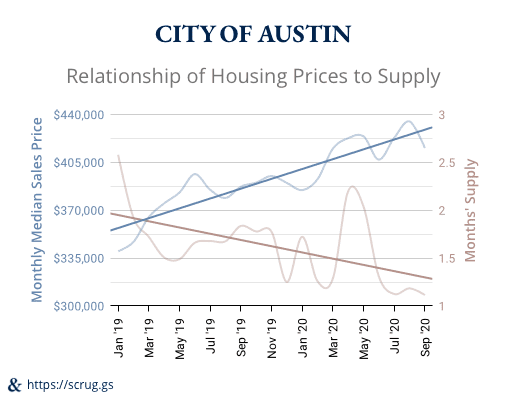
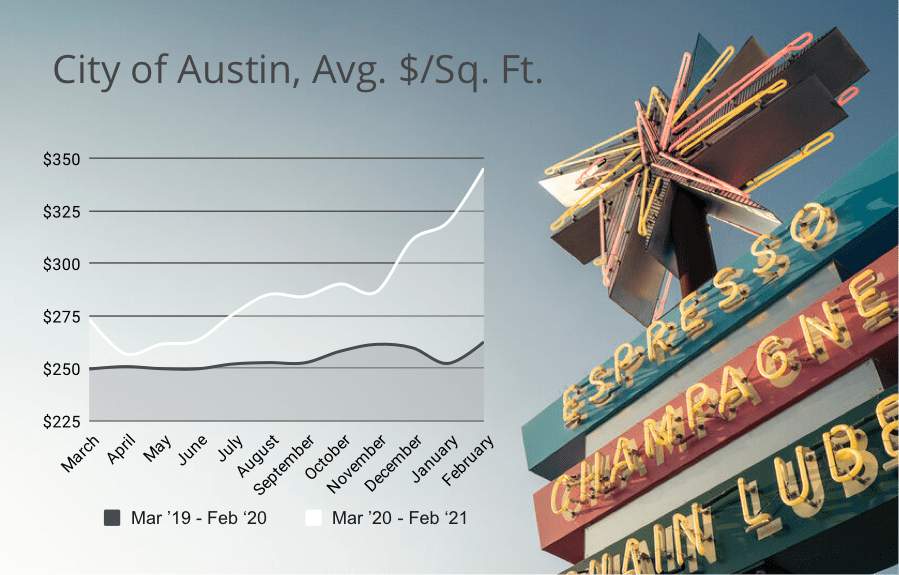
Housing prices trend up as housing supply trends down.
In July, we covered why extreme price increases are deleterious for Austin. Last month, the average home sale price dropped 1.3% to $543K. The median sales price decreased 4.5%, landing at $415K. In the same breathe, inventory dropped 5.5% matching July’s record low of 1.1 months’ supply. These short-lived price drops offer tangible relief for new home buyers. Still, expect prices to trend upward as long as inventory trends downward. If you’re buying in the next 6-months, message us for a homebuyer’s guide or custom search.
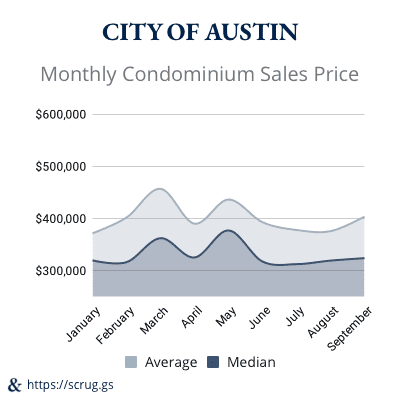
ince June, condo prices slowly rose back above January levels.
Despite September’s general price drops, the average condo sale price went up almost $28K. The 7.3% increase pushed the average condo sale price up to $403K. At almost $324K, the median condo sale price creeped back above January’s median of almost $320K.
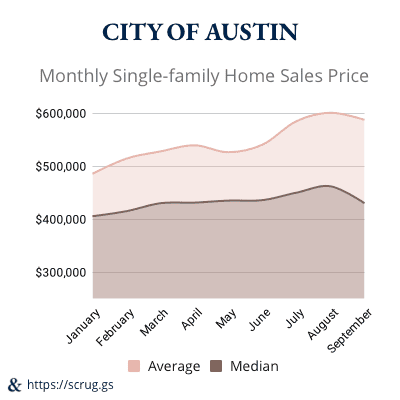
Single-family home prices dipped in September, but are still trending up.
75% of September’s closed sales were single-family homes. The average single-family sales price for September was $587K, down ~2% from a steep $601K average in August. The median price for single-family sales dropped 7% from $462K in August to $430K in September. This $32K decrease was the first drop and biggest change in the single-family median this year. The City hasn’t done much to improve Austin’s affordability problem. But the conditions for a price break are here right now in the form of lower interest rates. 30-year mortgage rates dropped more than 1% year-over-year in September. Owning a home at this September’s average price and interest rate would cost $1,369,800 over the term of a 30-year loan. A home at last September’s average price and interest rate would cost $1,230,250 for that same term. That’s almost a $140K difference. If interest rates had stayed the same, the difference would have been $253K. October rates are even lower than September’s. If you plan to sell your home in the next two years, it may not be worth the fees to refinance at a lower rate. Whatever your situation, we offer expert advice for your homeownership needs. Contact us today, or connect with us on Facebook and Instagram.